



Net Worth Chart: Understand Wealth Trends and Patterns
 Jillian Hunt
June 17, 2025 6:12 pm
.
10 min read
Jillian Hunt
June 17, 2025 6:12 pm
.
10 min read

Sarah stared at her monthly budget spreadsheet, frustrated. Despite steady income, her savings never seemed to grow. A financial advisor friend suggested she look beyond income alone. “What’s your financial snapshot?” he asked. “Numbers tell stories – but you need the right tools to read them.”
This guide reveals how wealth metrics paint clearer pictures of financial health than income alone. Using proprietary research and Federal Reserve data, it breaks down median and average figures across age groups. Readers discover how Americans accumulate assets – and where they might fall short.
The visual tool at the heart of this analysis highlights three key patterns:
• How early career choices impact long-term stability
• Why peak earning years don’t always mean peak wealth
• What separates top performers from median results
Data from consumer surveys adds practical context. Learn to interpret these metrics through real-world examples. Later sections offer actionable strategies for improving personal financial positions.
What Is Net Worth and How Is It Calculated?
Emily reviewed her bank statements, puzzled by conflicting numbers. A retirement calculator showed progress, but her credit card balance told another story. Like many Americans, she needed a clearer way to measure true financial standing.
Defining Assets and Liabilities
Assets include anything you own with monetary value. Common examples are:
- Cash in checking/savings accounts
- Investments like stocks or mutual funds
- Retirement accounts (401(k), IRAs)
- Real estate equity
Liabilities represent debts owed. These might be:
- Credit card balances
- Mortgage loans
- Student or auto loans
The Calculation Method and Its Importance
Subtract total liabilities from total assets to find your financial position. The Federal Reserve uses this formula in its Survey of Consumer Finances to track national trends. Accuracy matters – undervaluing a home or forgetting a medical bill skews results.
Understanding where you stand for your worth age helps identify gaps. A 35-year-old with $150,000 in assets but $120,000 in debt has different needs than someone nearing retirement. Tools from reputable financial platforms simplify tracking.
Questions about specific scenarios? Many institutions welcome email inquiries to clarify calculations. Regular check-ups using this method create actionable insights for long-term stability.
Interpreting the Net Worth Chart: Trends and Metrics
Michael, a high school teacher, first saw the wealth trends chart during a financial workshop. Its colored lines and age brackets initially confused him – until he learned to decode its story.

Understanding Chart Components and Data Sources
The horizontal axis shows age groups in 10-year increments. Vertical bars represent monetary values, while colored lines distinguish median from average figures. This visual contrast reveals gaps between typical households and top earners.
Data comes from two key sources:
- Federal Reserve Survey of Consumer Finances (2022)
- Empower’s anonymized user dashboards
Why focus on both median and average? Consider this: The median for 45-54 year-olds sits at $168,600, while the average jumps to $833,200. This difference shows how extreme wealth concentrations skew averages upward.
Recent surveys highlight shifting patterns. Millennials hold 30% less wealth at age 40 than baby boomers did. Generation X shows faster debt reduction but slower asset growth compared to previous decades.
As you explore the chart, notice how:
- Blue triangles mark major life events (home purchases, retirement)
- Gray shading indicates economic recessions
- Dotted lines project future trends
These elements transform raw numbers into actionable insights. What patterns emerge when you trace your age group’s trajectory?
Age-Demographics: Tracking Net Worth Over a Lifetime
Lisa, a nurse practitioner, noticed her colleagues’ varying financial situations during lunch breaks. Some planned early retirements while others worried about medical bills. This disparity reflects how age shapes economic trajectories.

Average and Median Figures by Decade
The Federal Reserve Survey of Consumer Finances reveals distinct patterns:
- 20s: $14,000 median ($76,000 average)
- 30s: $90,000 median ($436,000 average)
- 50s: $315,000 median ($1.2 million average)
These gaps show how high earners skew averages. By age 65, median household value peaks at $266,400 before declining. Empower’s research confirms this trend across 500,000 anonymized profiles.
Retirement’s Financial Impact
Post-65, median assets drop 28% within eight years. Why? Three factors dominate:
Also Read:
- Withdrawing retirement funds
- Reduced income streams
- Unexpected healthcare costs
Recent survey consumer data shows 63% of retirees dip into savings faster than planned. This makes strategic withdrawal rates crucial. Tools in our financial planning resources help bridge gaps between expectations and reality.
Understanding these age-based shifts helps create smarter strategies. Whether building career foundations or managing golden years, recognizing typical value changes empowers better decisions.
How Federal Reserve Data Informs Wealth Analysis
Rachel, a public librarian, discovered discrepancies between her retirement projections and her actual savings. A colleague handed her the latest Federal Reserve report. “Numbers don’t lie,” they said. “But you need to know which numbers matter.”

Insights from the Survey of Consumer Finances
The Federal Reserve collects financial data from 12,000+ households every three years. Their Survey of Consumer Finances tracks:
- Home equity growth rates
- Debt-to-income ratios
- Retirement account balances
2022 data shows the median household holds $121,700 in assets. But the average jumps to $748,800 – six times higher. This gap reveals how top earners distort national averages.
Comparing Federal Data with Consumer Trends
Independent surveys tell a different story. NerdWallet’s 2023 money study found:
- 42% of Americans carry credit card debt monthly
- Home values account for 67% of median household wealth
- Student loans delay major life milestones by 4-7 years
These findings align with Federal Reserve debt statistics but highlight personal struggles numbers alone can’t capture. For example, while official reports show rising home equity, many homeowners feel “house rich but cash poor.”
Smart financial planning uses both perspectives. Government data identifies broad patterns, while consumer surveys expose daily money challenges. Tools from verified financial platforms help bridge this gap, turning abstract numbers into actionable steps.
Strategies for Building and Increasing Net Worth
Carlos stared at his retirement account statement, shocked. At 52, his savings barely covered two years of expenses. Like many Americans, he needed actionable steps to bridge the gap between his current financial position and long-term goals.

Early Financial Habits and Savings in Your 20s
Starting young creates exponential growth. A 25-year-old saving $300 monthly could amass $1 million by 65, assuming 7% annual returns. Three habits make this work:
- Automate 15-20% of income into retirement accounts
- Limit credit card use to preserve credit scores
- Track spending weekly using app alerts
Recent surveys show millennials who began saving at 25 have 3x more assets than those who started at 35. Small choices compound dramatically.
Maximizing Investments and Minimizing Debt in Later Years
After 40, focus shifts to optimizing existing resources. Prioritize:
- Paying high-interest debts first (rates >6%)
- Rebalancing portfolios annually
- Increasing 401(k) contributions during peak earnings
A person earning $100,000 could boost retirement savings by $250,000 through strategic raises alone. Studies reveal maintaining a 50/50 balance between stocks and bonds reduces risk while preserving growth.
Whether building foundations or refining strategies, consistent action creates measurable change. The right number of smart moves today shapes tomorrow’s financial reality.
Also Read:
Exploring U.S. Net Worth Benchmarks for 2023
Jenna and Mark sat at their kitchen table, comparing their joint finances to a newly released benchmark report. Like many families, they wondered: “Are we keeping pace with national trends?”

Median Versus Average Net Worth Insights
Recent data shows a $121,700 median household value versus a $748,800 average. This six-fold difference reveals how top earners distort national figures. For typical consumers, median numbers better reflect everyday financial realities.
Key 2023 comparisons:
- Top 10% households hold 69% of U.S. wealth
- Median car equity accounts for 9% of assets
- Families with student debt average $58,000 lower net worth
Analyzing Top Percentile Wealth Data
The wealthiest 1% hit $11.1 million thresholds in 2023. Higher tiers escalate rapidly:
- Top 0.5%: $17.5 million
- Top 0.1%: $43.3 million
Investment portfolios drive these gaps. While median households keep 34% of assets in home equity, top performers allocate 61% to stocks and private businesses. Managing liabilities becomes crucial – high-net-worth families often use strategic debt for tax advantages.
For most consumers, balancing car payments with retirement savings remains critical. Benchmarks suggest allocating no more than 8% of income to auto costs. Regular check-ins against these markers help families course-correct before gaps widen.
Real-World Applications of Net Worth Data
David flipped through his financial planner, stopping at a colorful diagram. Unlike complex spreadsheets, this visual tool mapped his progress against national benchmarks – finally making sense of his money journey.
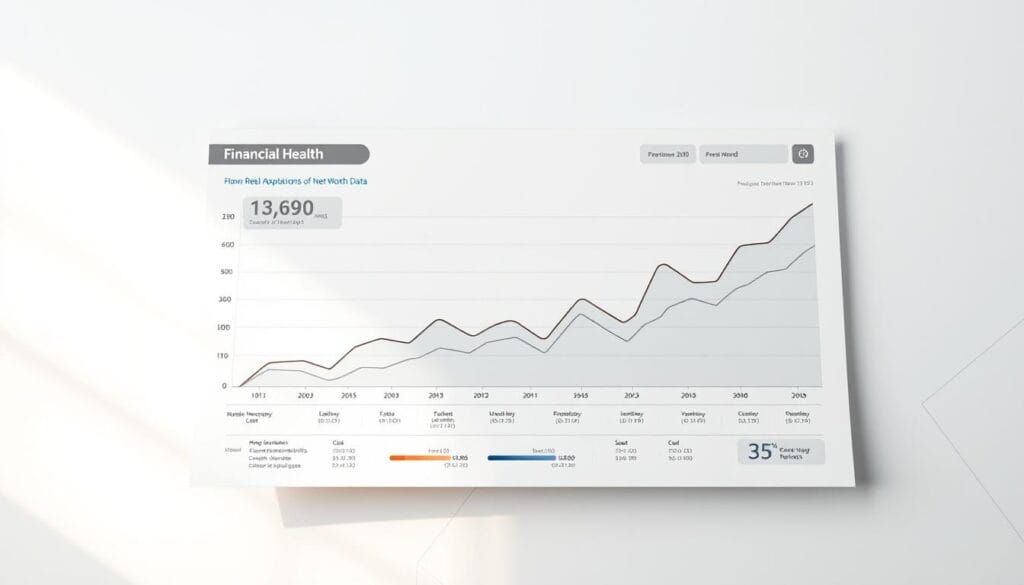
Using the Chart to Gauge Financial Health
Comparing personal numbers to market averages reveals critical insights. A 40-year-old with $250,000 in assets might feel ahead of peers. But if the average for their age group is $436,000, it signals room for improvement.
Three actionable checks:
- Measure debt-to-asset ratios quarterly
- Track investment growth against inflation rates
- Compare emergency savings to 6-month expense benchmarks
These steps help spot gaps before they widen. Someone earning $75,000 annually but carrying $50,000 in credit card debt has a different risk profile than others with similar incomes.
Planning for Retirement, Investments, and Debt Management
Strategic adjustments create measurable change. Increasing retirement contributions by 3% annually could add $190,000 to a 401(k) over 20 years. Debt management matters too – refinancing a $300,000 mortgage at 2% lower rates saves $350 monthly.
Key differences to watch:
- Compound growth versus simple interest
- Tax-advantaged accounts versus taxable investments
- Fixed-rate versus variable debt
Regular check-ins using these metrics help tailor strategies. A teacher might prioritize pension optimization, while a freelancer focuses on diversifying income streams. Tools from verified financial platforms turn abstract data into personalized roadmaps.
Final Insights on Navigating Wealth Trends
Maya and Tom left their financial seminar with fresh printouts, determined to decode their family’s position. Like many households, they realized true progress starts with clear metrics – not just income figures.
Federal Reserve studies reveal critical patterns. Median household net worth often trails averages due to wealth concentration. For example, the 2022 data shows top earners hold 69% of U.S. assets, skewing national numbers upward. Tracking both metrics helps families set realistic goals.
Three strategies stand out for lasting stability:
• Monitor credit card balances monthly to avoid interest traps
• Maintain emergency cash reserves covering 3-6 months of expenses
• Compare personal progress against Federal Reserve benchmarks annually
This article’s analysis simplifies complex data into practical steps. By focusing on household net worth trends, readers gain tools to assess debt ratios, investment growth, and retirement readiness. Governors of the Federal Reserve consistently emphasize these metrics as economic health indicators.
For personalized guidance, explore verified financial resources. Regular check-ins using these insights help bridge gaps between current standings and long-term aspirations. Wealth-building isn’t about chasing averages – it’s about mastering your unique financial story.
FAQ
How do assets and liabilities factor into net worth?
Assets include everything a person owns, like savings, homes, or investments. Liabilities are debts, such as loans or credit card balances. Subtracting liabilities from assets reveals an individual’s financial position.
Why are median and average values both used in wealth analysis?
The median shows the middle point, reducing the impact of extreme highs or lows. Averages can skew higher due to top earners. Together, they provide a clearer picture of typical versus outlier financial situations.
What role does age play in financial growth?
Younger individuals often focus on paying off debt and building savings. Middle age brings higher earnings and investments, while older adults prioritize retirement stability and managing healthcare costs.
How reliable is Federal Reserve data for personal finance planning?
The Survey of Consumer Finances offers detailed insights into income, debt, and asset trends across demographics. While helpful, pairing this data with personal circumstances ensures more tailored strategies.
What habits help build long-term financial security?
Starting early with consistent savings, avoiding high-interest debt, and diversifying investments create a strong foundation. Later, optimizing retirement accounts and minimizing expenses further boosts stability.
How do top earners influence national wealth benchmarks?
High-earning households often drive up average values, creating gaps between median and mean figures. Analyzing percentiles helps distinguish widespread trends from concentrated wealth patterns.
Can net worth charts guide retirement planning?
Yes. They highlight typical asset growth rates and common liabilities by age group. This helps individuals set realistic goals for savings, debt reduction, and post-career income needs.
Why track financial health using external data?
Comparing personal progress to broader trends identifies strengths and gaps. It also encourages proactive adjustments, like increasing investments or paying off credit cards faster.
Asset visualizationFinancial patternsMoney managementNet worth analysisPersonal FinancesWealth Trends
Hey there! I'm Jillian Hunt. I'm all about diving into the financial side of celebrities' lives and sharing those juicy details with you. I love turning complicated money stuff into fun and easy reads. Whether it's checking out how a newbie is making waves or seeing what the big names are doing with their cash, I'm here to give you the scoop in a way that's both interesting and easy to understand.